Since we finished the work described in the Large Scale Search Report we have made some changes to our test protocol and upgraded our Solr implementions to Solr 1.3. We have completed some testing with increased memory and some preliminary load testing.
The new test protocol has these features
- We increased the Solr caches from the default out-of-the-box configurations
- Query results cache (queryResultsCache); Changed from 512 to 100,000 query result sets
- Document cache (documentCache) ;Changed from 512 to 50,000 documents
- We increased the query results window size (queryResultWindowSize) from the default 10 to 100
- We are now using 10,000 warm-up queries prior to running tests
- We are running 1,000 test queries
- We are now including average response time in our reporting
- We are now logging server statistics.
The Solr query results cache keeps a list of the search results for a particular query. We now have it set to keep the results for 100,000 queries. Since the result list is a list of document ids this does not take up much space, but when a query is repeated, Solr does not have to do the search processing for that query. The Solr document cache keeps the stored fields for a document in cache. We now have it set for 50,000 documents. The query result window size helps when a user requests the next page of results. What it does is fetch N results (which we now have set to 100) instead of just the top 10, so that when the user clicks to see the next 10 results, the data is already in memory and doesn't have to be read from disk. We increased the number of warm-up queries to get more realistic results.
Memory Testing
Since one of the frequently mentioned suggestions on the Solr list for increasing search performance is to increase the memory available for disk caching by the operating system, we increased the memory on our machines to 32GB.
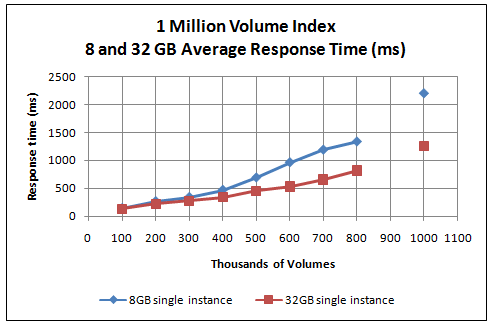
The chart below shows the response times for our single 1 Million Volume Index with 8 and 32GB of memory. About 2GB was dedicated to the JVM running Tomcat/Solr, so there were 6GB and 30GB respectively available for the operating system disk cache.
Memory Tests
We were somewhat disappointed that the increase in memory did not result in a more significant increase in performance. However, since the size of our index is around 225GB, we probably need a lot more memory to see a large performance increase.
Load Testing
Our previous tests were sequential. The testing program did a search and then waited for the results before doing the next search. This simulates the actions of one user. However, when there are multiple users, we can expect the server to get multiple requests within a relatively short time period.
We don't know what rate of requests we will get in practice once the beta Large Scale Search goes into production. Our OPAC logs indicate that 97% of the time the request rate is below one query every two seconds and 99.99% of the time its below 1 query per second. The request rates for our Large Scale Search beta are about the same; 99% of the time the request rate is one query every two seconds or less. Over the four months the beta has been in operation there was one minute in which the request rate was about 1.4 queries per second. This was the highest request rate we observed.
We ran tests where we sent 1,2,4,8 and 16 queries per second to Solr against our 1 million volume index. The tests were artificial in that (after the 10,000 query warm-up) we only sent our 1,000 test queries and then stopped sending queries. At 16 queries per second that means that after the warm-up was completed in the first minute or so we sent all our queries and then no more queries were sent to the server. In practice, although we can expect bursty activity, it would be unlikely that after a minute of 16qps, that the requests would stop coming in for the next several minutes while Solr dealt with the backup of queries.
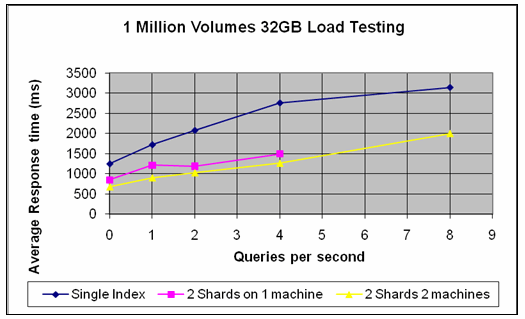
Load Testing 1 Million Volumes
Above 4 queries per second the 2 Shards on 1 machine configuration response times went up from 1.5 seconds to 20-45 seconds. Above 8 queries per second the response time for 2 shards on 2 machines had a similar steep upward climb. ( We aren't showing these on the chart, since the scale would obscure all the other results.)
If the average response time is more than 1 second, and we are getting 2 or more queries per second, queries are coming in faster than Solr can handle them and will back up. So with our present configuration only the 2 shards on 2 machines configuration can handle 1 query per second on a sustained basis. Average query rates of 2 or more queries per second can not be sustained with our current configurations. We plan to do further load testing once we make some changes to get better performance in general.
In order to get an idea of the disk I/O load being put on our storage server we ran the iostat utility while tests were being conducted. The chart below shows the average I/O transactions per second for a 1 query per second resquest rate at various index sizes. Dm7 and dm8 are the two raid arrays containing the Solr index data. One raid array was dedicated to each shard and the index sizes reported in the chart are the combined number of volumes for the two shards. The curve changes slope and gets significantly steeper around 600,000 documents. We are taking that as an indication that the sweet spot in terms of I/O demand for our present configuration with 32GB of memory is around 600,000 volumes.
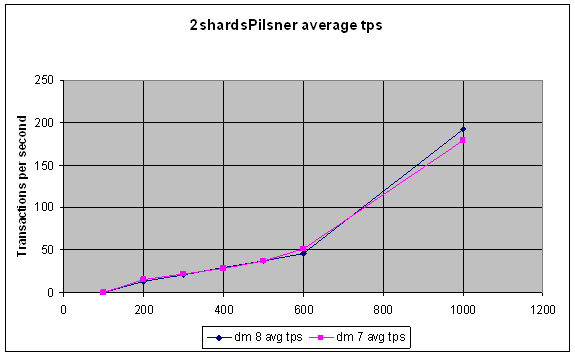
Transactions per Second
Coming next: Slow queries and reducing Disk IO
Add new comment